2020 Kentucky KIDS COUNT Data Dashboard
Please visit this page from a computer to view our interactive data dashboard
ECONOMIC SECURITY
Baseline Data
Latest Data
Change Since Baseline*
Data by Race/Ethnicity
CHILDREN IN DEEP POVERTY
(below 50% of the federal poverty level)
NUMBER OF CHILDREN: 113,000 (2014-18)
Children in Deep Poverty (below 50% of the federal poverty level)
Growing up in poverty is the single greatest risk to children’s well-being. When families face economic hardship, children are more likely to experience a range of adversities that may impact their development and limit their opportunities for success as adults. Children living in deep poverty and young children are at the greatest risk. For a family of four in Kentucky, living in deep poverty means surviving on an annual income of $12,018 or less.
12%
2009-13
11%
2014-18
Children in deep poverty (percent)

Source: U.S. Census Bureau, 5-Year American Community Survey Estimates, Table B17024
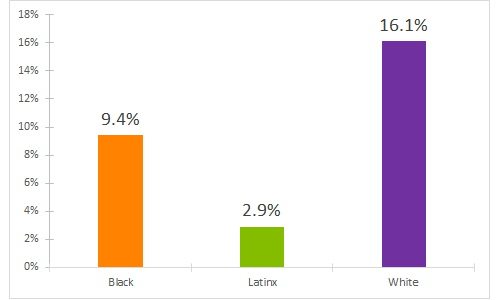
Children in deep poverty (below 50% of the federal poverty level), 2018

Source: Population Reference Bureau analysis of data from the U.S. Census Bureau, American Community Survey.
Note: Data for Native American and Black children suppressed due to unreliable estimates.
CHILDREN IN POVERTY
(below 100% of the federal poverty level)
NUMBER OF CHILDREN: 219,000 (2018)
Children in Poverty
Kentucky’s future prosperity depends on all children living in a financially stable family where parents can provide for their children, yet children are much more likely to be poor than working-age adults and the elderly.[i] In 2015, a family of two adults and two children was considered to be living in poverty if their household income was at or below $24,036.
Growing up in a financially stable family allows children to avoid the threats caused by poverty to their physical and mental health, social-emotional development, and educational attainment, such as the increased risks of teen pregnancy and not finishing high school.[ii] For example, children who are poor for half their childhoods are 90 percent more likely not to complete high school than non-poor children.[iii] The long-term consequences of childhood poverty include lower occupational status, lower wages, and poorer health in adulthood.[iv]
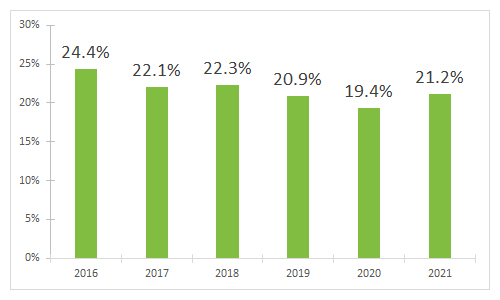
Kentucky’s child poverty rate has been persistently higher than the national rate. While slightly less than one in every five children nationally live in poverty, at least one in every four Kentucky children are poor.[v] We know it is possible to reduce Kentucky’s high rate of childhood poverty, as the state’s rate consistently fell between 1995 and 2000.[vi]
[i] Jiang, Y., Granja, M.R., and Koball, H. (2017). Basic Facts about Low-Income Children: Children under 18 Years, 2015. National Center for Children in Poverty. Available at http://www.nccp.org/publications/pub_1170.html. Accessed November 2017.
[ii] Ratcliffe, C. and McKernan, SM. (2012). Child Poverty and Its Lasting Consequence. The Urban Institute. Available at http://www.urban.org/research/publication/child-poverty-and-itslasting-consequence. Accessed November 2017.
[iii] Fiester, L. (2013). Early Warning Confirmed: A Research Update on Third-Grade Reading. Annie E. Casey Foundation. Available at http://www.aecf.org/resources/early-warning-confirmed/. Accessed November 2017.
[iv] Child Trends Databank (2016). Children in Poverty. Available at https://www.childtrends.org/indicators/children-in-poverty/. Accessed November 2017.
[v] Annie E. Casey Foundation (2017). KIDS COUNT Data Center. Available at http://datacenter.kidscount.org/data/tables/43-children-in-poverty-100-percent-poverty?loc=19&loct=2#detailed/2/19/true/870,573,869,36,868/any/321,322. Accessed November 2017.
[vi] Kentucky Youth Advocates (2015). Good Public Policies = A Brighter Future for Kentucky Kids: A 25 Year Retrospective. Available at http://kyyouth.org/kentucky-kids-count/25years/. Accessed November 2017.
25.5%
2013
22.3%
2018
Children in poverty (percent)

Source: U.S. Census Bureau, Small Area Income and Poverty Estimates
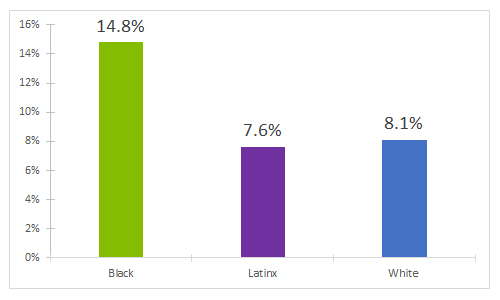
Children in poverty (below 100% of the federal poverty level), 2019

Source: Population Reference Bureau analysis of data from the U.S. Census Bureau, American Community Survey.
Note: Data for Native American children suppressed due to unreliable estimate.
CHILDREN IN LOW INCOME FAMILIES
(below 200% of the federal poverty level)
NUMBER OF CHILDREN: 459,000 (2014-18)
Children in Low-income Families (below 200% of the federal poverty level)
Children fare better when their families can pay their bills and buy what they need. Research suggests that families need to earn about twice the federal poverty level to cover their basic expense. For a family of four in Kentucky, being low-income means trying to make ends meet on an annual income of $48,072 or less.
49%
2009-13
46%
2014-18
Children in low-income families (percent)

Source: U.S. Census Bureau, 5-Year American Community Survey Estimates, Table B17024
Children in low-income families (below 200% of the federal poverty level), 2018

Source: Population Reference Bureau analysis of data from the U.S. Census Bureau, American Community Survey.
Note: Data for Native American, Asian and Pacific Islander, and multiracial children suppressed due to unreliable estimates.
CHILDREN LIVING IN FOOD INSECURE HOUSEHOLDS
NUMBER OF CHILDREN: 191,000 (2018)
Children Living in Food Insecure Households
Adequate nutrition is essential for children’s physical growth and brain development, yet hundreds of thousands of Kentucky children must worry about when their next meal will be. Children living in food insecure households experience limited or uncertain availability of nutritionally adequate foods.
Food security is especially critical during early childhood – when the foundation is laid for cognitive functioning – as inadequate nutrition can permanently alter the brain architecture and stunt intellectual capacity. Children who do not receive what they need for strong, healthy brain development during early childhood may never recover their lost potential for cognitive growth.[i]
In addition to cognitive problems, children experiencing food insecurity are more likely than others to have poorer physical and oral health, higher rates of chronic health conditions and hospitalization, higher levels of aggression and anxiety, and experience behavioral problems.[ii],[iii],[iv]
Since 2012, Kentucky has had higher rates of children living in food insecure households than the nation as a whole.[v] We know it is possible to reduce the rate of children living in food insecure households; after the national rate jumped at the start of the Great Recession, it has been gradually declining.[vi]
[i] Center on the Developing Child (2010). The Foundations of Lifelong Health (InBrief). Available at https://developingchild.harvard.edu/resources/inbrief-the-foundations-of-lifelong-health/. Accessed October 2017.
[ii] Beaulieu, S.M. (2014). Current and Prospective Scope of Hunger and Food Security in America: A Review of Current Research. RTI International. Available at https://www.rti.org/sites/default/ files/resources/full_hunger_report_fi
24-14.pdf. Accessed October 2017.
[iii] Gunderson, C. and Ziliak, J.P. (Fall 2014). “Childhood Food Insecurity in the U.S.: Trends, Causes, and Policy Options. The Future of Children.” Available at http://www.futureofchildren.org/sites/futureofchildren/files/media/childhood_food_insecurity_researchreport-fall2014.pdf. Accessed October 2017.
[iv] Child Trends Databank (2016). Food Insecurity. Available at https://www.childtrends.org/indicators/food-insecurity/. Accessed October 2017.
[v] Annie E. Casey Foundation (2016). KIDS COUNT Data Center. Available at http://datacenter.kidscount.org/data/line/5201-children-living-in-households-that-were-food-insecure-at-some-point-during-the-year?loc=1&loct=1#2/19/true/869,36,868,867,133,38,35,18,17,16/asc/any/11675. Accessed October 2017.
[vi] Coleman-Jensen, A., Rabbitt, M.P., Gregory, C.A., and Singh, A. (2017). Household Food Security in the United States in 2016. U.S. Department of Agriculture, Economic Research Service. Available at https://www.ers.usda.gov/webdocs/publications/84973/err-237.pdf?v=42979. Accessed October 2017.
18.9%
2018

EDUCATION
Baseline Data
Latest Data
Change Since Baseline*
Data by Race/Ethnicity
KINDERGARTENERS READY TO LEARN
NUMBER OF CHILDREN: 24,570 (SY 2019-20)
Kindergarteners Ready to Learn
Creating a vibrant Kentucky starts with the state’s youngest citizens. Kindergarten readiness measures whether a child has developed the cognitive, language, physical, self-help, and social-emotional skills needed to succeed in school. Research shows that children who start formal education with stronger school readiness skills tend to maintain that advantage throughout their elementary school years, whereas children who enter with lower school readiness skills experience a persistent disadvantage.
50.0%
SY 2014-15
51.0%
SY 2019-20
Kindergarteners ready to learn (percent)

Source: Kentucky Department of Education, Supplemental Data
HIGH SCHOOL STUDENTS GRADUATING ON TIME
NUMBER OF TEENS: 44,584 (SY 2019-20)
High School Students Graduating on Time
A high school diploma is essential to achieve economic self-sufficiency. High school graduates earn more than those without diplomas, contribute more in taxes, and use public assistance less often. In turn, failure to graduate is associated with a lifetime of lower wages, poorer health, and higher rates of incarceration. Children in families that move frequently have a lower probability of graduation. Poor access to community resources, such as counseling or tutoring programs, also influences drop-out rates. Individual factors, such as academic performance, behavior, and absenteeism impact students’ decisions. Children are less likely to drop out of schools with a strong academic climate.
88.0%
SY 2014-15
90.9%
SY 2019-20
High school students graduating on time (percent)

Source: Kentucky Department of Education, School Report Card
STUDENTS WITH AN INDIVIDUALIZED EDUCATION PLAN
NUMBER OF CHILDREN: 104,928 (SY 2019-20)
Students With an Individualized Education Plan
15%
SY 2019-20
Students with Individualized Education Plans, SY 2019-20

Source: Kentucky Department of Education.
STUDENT HOMELESSNESS
NUMBER OF CHILDREN: 21,648 (SY 2019-20)
Student Homelessness
4%
SY 2015-16
3%
SY 2019-20

HEALTH
Baseline Data
Latest Data
Change Since Baseline*
Data by Race/Ethnicity
SMOKING DURING PREGNANCY
NUMBER OF BIRTHS: 28,841 (2016-18)
Smoking During Pregnancy
A healthy start in life begins during pregnancy. Maternal smoking diminishes that good start. Babies born to mothers who smoked during pregnancy are more likely to suffer from low birthweight and premature birth. Infant death and sudden infant death syndrome (SIDS) are also more common when a mother smokes, as are birth defects such as cleft lip and palate. When a woman quits smoking during pregnancy, especially if she quits early in the pregnancy, infant health benefits.
20.4%
2011-13
17.8%
2016-18
Smoking during pregnancy (percent)

Source: Kentucky Cabinet for Health and Family Services, Vital Statistics Branch
Smoking during pregnancy, 2016-2018

Source: Kentucky Cabinet for Health and Family Services, Vital Statistics, processed by the Kentucky State Data Center.
Note: Data not available for other racial groups.
LOW-BIRTHWEIGHT BABIES
NUMBER OF BABIES: 14,552 (2016-18)
Low-Birthweight Babies
All children deserve a strong start in life and a healthy birthweight plays an important role. Several maternal health, socioeconomic, and environmental factors contribute to the likelihood of low infant birthweight (less than 5.5 pounds).
Cigarette smoking during pregnancy is the single most important known cause of low birthweight,[i] but even pregnant women who are exposed to secondhand smoke are more likely to have babies born at a low birthweight.[ii]
Infants born at a low birthweight are more likely to face short- and long-term health complications and are 25 times more likely to die within their first year of life than those born at a normal weight.[iii],[iv] Low-birthweight babies are more likely to experience delayed motor and social development.[v] Low birthweight is also associated with impaired cognitive development, which impacts educational success, regardless of socioeconomic status.[vi]
After decades of steady worsening,[vii] Kentucky’s rate of low-weight births has plateaued but remains higher than the national rate.[viii]
[i] U.S. Department of Health and Human Services (2014). The Health Consequences of Smoking—50 Years of Progress: A Report of the Surgeon General. U.S. Department of Health and Human Services, Centers for Disease Control and Prevention, National Center for Chronic Disease Prevention and Health Promotion, Office on Smoking and Health. Available at http://www.surgeongeneral.gov/library/reports/. Accessed November 2017.
[ii] U.S. Department of Health and Human Services (2006). The Health Consequences of Involuntary Exposure to Tobacco Smoke: A Report of the Surgeon General. U.S. Department of Health and Human Services, Centers for Disease Control and Prevention, National Center for Chronic Disease Prevention and Health Promotion, Office on Smoking and Health. Available at http://www.surgeongeneral.gov/library/reports/. Accessed November 2017.
[iii] March of Dimes (2014). Low Birthweight. Available at http://www.marchofdimes.com/baby/low-birthweight.aspx. Accessed November 2017.
[iv] Mathews, T.J., MacDorman, M.F., and Thoma, M.E. (2015). “Infant Mortality Statistics from the 2013 Period Linked Birth/Infant Death Data Set.” National Vital Statistics Reports, vol. 64, no. 9. National Center for Health Statistics. Available at http://www.cdc.gov/nchs/data/nvsr/nvsr64/nvsr64_09.pdf. Accessed November 2017.
[v] Hediger, M. L., Overpeck, M. D., Ruan, W. J., and Troendle, J. F. (2002). Birthweight and Gestational Age Effects on Motor and Social Development. Pediatric and Prenatal Epidemiology, vol. 16, no. 1. Available at http://citeseerx.ist.psu.edu/viewdoc/download?doi=10.1.1.947.7649&rep=rep1&type=pdf. Accessed November 2017.
[vi] Boardman, J.D., Powers, D.A., Padilla, Y.C., and Hummer, R.A. (2002). “Low Birth Weight, Social Factors, and Developmental Outcomes Among Children in the United States.” Demography, vol. 39, no. 2. Available at https://www.researchgate.net/publication/11324513_Low_Birth_Weight_Social_Factors_and_Developmental_Outcomes_Among_Children_in_the_United_States. Accessed November 2017.
[vii] Kentucky Youth Advocates (2015). Good Public Policies = A Brighter Future for Kentucky Kids: A 25 Year Retrospective. Available at http://kyyouth.org/kentucky-kids-count/25years/. Accessed November 2017.
[viii] Annie E. Casey Foundation (2017). KIDS COUNT Data Center. Available at http://datacenter.kidscount.org/data/line/5425-low-birth-weight-babies?loc=1&loct=1#2/19/true/573,869,36,868,867,133,38,35,18,17/asc/any/11985. Accessed November 2017.
8.8%
2011-13
8.9%
2016-18
Low-birthweight babies (percent)

Source: Kentucky Cabinet for Health and Family Services, Vital Statistics Branch
Low-birthweight babies, 2016-2018

Source: Kentucky Cabinet for Health and Family Services, Vital Statistics, processed by the Kentucky State Data Center.
Note: Data not available for other racial groups.
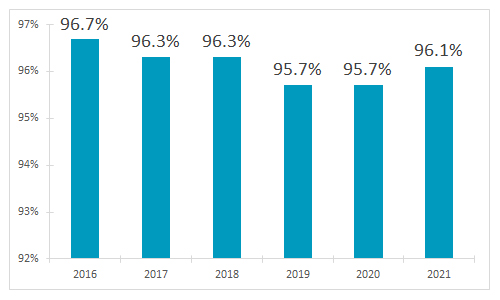
CHILDREN UNDER 19 WITH HEALTH INSURANCE
NUMBER OF CHILDREN: 996,000 (2018)
Children Under 19 With Health Insurance
Health impacts every aspect of a child’s life and is one of the most important components of overall child well-being. For optimal health, children need access to health coverage that allows them to receive high-quality care addressing their physical, behavioral, oral, and vision health needs.
Children with health coverage are more likely to receive regular preventive care, such as well-child exams, and to stay connected to a primary care doctor, whereas children without health insurance are at greater risk for hospitalization.[i] Continuous health coverage for children has been linked to reduced child mortality rates and increased health status of children.[ii]
Although the provision of employer-sponsored health insurance is declining, and most parents with low-wage or part-time work lack coverage through their employer, public health insurance has resulted in increased coverage of children during the past decade.[iii] In Kentucky, means-tested public coverage for children includes Medicaid and the Kentucky Children’s Health Insurance Program, and 40 percent of Kentucky’s insured children receive their coverage solely from those programs.[iv]
After decades of progress, Kentucky’s rate of uninsured children has reached an all-time low.[v] Since 2008, Kentucky has had a lower rate of uninsured children than the nation.[vi]
[i] Child Trends Databank (2016). Health Care Coverage. Available at https://www.childtrends.org/indicators/health-care-coverage/. Accessed October 2017.
[ii] Leininger, L. and Levy, H. (2015). “Child Health and Access to Medical Care.” The Future of Children, vol. 25, no. 1. Available at http://www.jstor.org/stable/43267763. Accessed October 2017.
[iii] Gould, E. (2012). A Decade of Declines in Employer-Sponsored Health Insurance Coverage. Economic Policy Institute. Available at http://www.epi.org/publication/bp337-employersponsored-health-insurance/. Accessed October 2017.
[iv] U.S. Census Bureau, American Community Survey (2017). Table B27010, 2016 1-Year Estimates. Available at http://factfinder.census.gov. Accessed October 2017.
[v] Kentucky Youth Advocates (2015). Good Public Policies = A Brighter Future for Kentucky Kids: A 25 Year Retrospective. Available at http://kyyouth.org/kentucky-kids-count/25years/. Accessed October 2017.
[vi] Annie E. Casey Foundation (2017). KIDS COUNT Data Center. Available at http://datacenter.kidscount.org/data/line/8810-children-without-health-insurance?loc=1&loct=2#2/19/true/870,573,869,36,868,867,133,38,35/asc/any/17658. Accessed October 2017.
93.5%
2013
96.3%
2018
Children under 19 with health insurance (percent)

Source: U.S. Census Bureau, Small Area Health Insurance Estimates
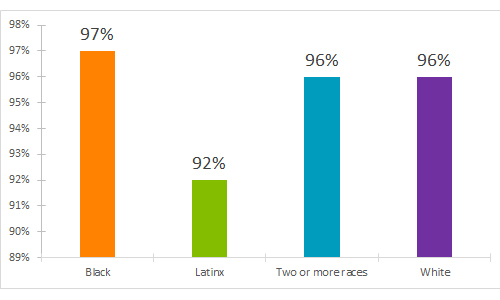
Children under 19 without health insurance, 2019

Source: Population Reference Bureau, analysis of data from the U.S. Census Bureau, American Community Survey.
Note: Data for Native American children suppressed due to unreliable estimate.
YOUNG ADULTS (AGES 19-25) WITH HEALTH INSURANCE
NUMBER OF YOUNG ADULTS: 368,000 (2014-18)
Young Adults (Ages 19-25) with Health Insurance
Young adults who have continuous health insurance are more likely to access the health services they need to stay healthy. While many perceive young adults as healthy and with less need for health care, they have significantly higher rates of visits to the emergency room than those immediately younger and older than them. In addition, the transition to adulthood is an important time to reach young adults with preventive services to detect early signs of illness and help them stop harmful behaviors like smoking and substance abuse. Young adults who age out of the foster care system and young adults involved in the justice system face greater difficulties in obtaining health care coverage.
89%
2014-18
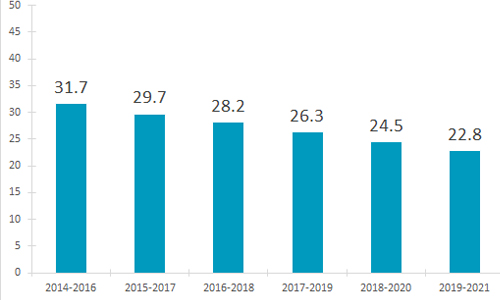
TEEN BIRTHS
(rate per 1,000 females ages 15-19)
NUMBER OF BIRTHS: 11,810 (2016-18)
Teen Births
Teenage childbearing puts two generations at risk of not succeeding. Adolescent mothers are less likely to receive high school diplomas, which severely curtails earnings potential, and their babies are more likely to be born prematurely and at a low birthweight. These infants are also at increased risk of dying before their first birthday. Children of teen mothers are more likely to experience abuse and neglect, struggle academically, and drop out of high school. Reducing childbearing among teens would save state spending on public health, child welfare, and incarceration while increasing tax revenue.
40.4
2011-13
28.2
2016-18
Teen births (rate per 1,000 females ages 15-19)

Source: Kentucky Cabinet for Health and Family Services, Vital Statistics Branch
Teen births (rate per 1,000 females ages 15-19), 2016-2018

Source: Kentucky Cabinet for Health and Family Services, Vital Statistics, processed by the Kentucky State Data Center.
Note: Data not available for other racial groups.

FAMILY & COMMUNITY
Baseline Data
Latest Data
Change Since Baseline*
Data by Race/Ethnicity
BIRTHS TO MOTHERS WITHOUT A HIGH SCHOOL DEGREE
NUMBER OF BIRTHS: 22,854 (2016-18)
Births To Mothers Without a High School Degree
Strong families raise successful children, and parents need educational levels that allow them to earn enough to provide for their families. Low levels of educational attainment strongly correlate to low incomes and poverty. In Kentucky, adults age 25 and over with less than a high school degree have less than half the median earnings of, and are more than seven times as likely to be poor than, those with at least a Bachelor’s degree.[i]
The more education parents have, the more likely their children are to be prepared for school, to succeed academically and complete high school by age 20, and the less likely they are to be born at a low birthweight, engage in unhealthy behaviors, and become a teenage parent.[ii],[iii],[iv] Research shows that “parents’ level of educational attainment is the best predictor of economic mobility for their children.”[v]
Over the past ten years, the share of Kentucky children whose head of household has at least completed high school has steadily increased and Kentucky is faring better than the nation as a whole.[vi] However, only six states in the U.S. have a higher (i.e. worse) rate than Kentucky of children living with a head of household whose highest level of education is a high school diploma or GED.[vii]
[i] U.S. Census Bureau, American Community Survey (2017). Table S1501, 2016 1-Year Estimates. Available at http://factfinder.census.gov. Accessed November 2017.
[ii] Child Trends (2015). Parental Education. Available at http://www.childtrends.org/indicators/parental-education/. Accessed November 2017.
[iii] Ratcliffe, C., and McKernan, SM. (2012). Child Poverty and Its Lasting Consequence. The Urban Institute. Available at http://www.urban.org/research/publication/child-poverty-and-itslasting-consequence. Accessed November 2017.
[iv] Boardman, J.D., Powers, D.A., Padilla, Y.C., and Hummer, R.A. (2002). “Low Birth Weight, Social Factors, and Developmental Outcomes Among Children in the United States.” Demography, vol. 39, no. 2. Available at https://
www.researchgate.net/profile/Yolanda_Padilla/publication/11324513_Low_Birth_Weight_Social_Factors_and_Developmental_Outcomes_Among_Children_in_the_United_States/links/0c960514a96c9675b9000000.pdf. Accessed November 2017.
[v] Ascend at the Aspen Institute. (2012). Two Generations, One Future: Moving Parents and Children Beyond Poverty Together. Available at: http://ascend.aspeninstitute.org/resources/two-generations-one-future. Accessed November 2017.
[vi] Annie E. Casey Foundation (2016). KIDS COUNT Data Center. Available at http://datacenter.kidscount.org/data/line/5203-children-by-household-heads-educational-attainment?loc=1&loct=1#2/19/true/573,869,36,868,867,133,38,35,18,17/asc/1312/11680. Accessed November 2017.
[vii] Annie E. Casey Foundation (2016). KIDS COUNT Data Center. Available at http://datacenter.kidscount.org/data/tables/5203-children-by-household-heads-educational-attainment?loc=1&loct=2#ranking/2/any/true/573/1313/11680. Accessed November 2017.
16.2%
2011-13
13.6%
2016-18
Births to mothers without a high school degree (percent)

Source: Kentucky Cabinet for Health and Family Services, Vital Statistics Branch
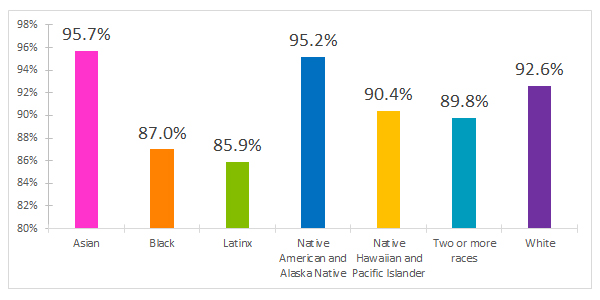
Births to mothers without a high school degree, 2016-2018

Source: Kentucky Cabinet for Health and Family Services, Vital Statistics, processed by the Kentucky State Data Center.
Note: Data not available for other racial groups.
CHILDREN IN FOSTER CARE
(rate per 1,000 children ages 0-17)
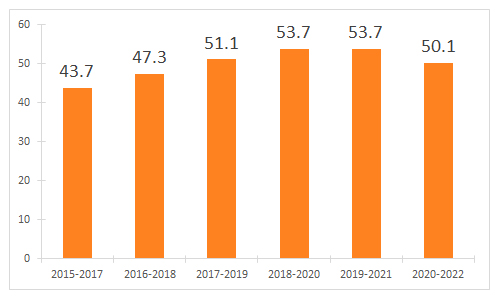
NUMBER OF CHILDREN: 51,547 (2017-19)
Children in Out-of-Home Care
All children need safe homes and loving families to thrive. When a child cannot safely remain with their parents due to abuse or neglect, relatives and close family friends (known as kin caregivers) or foster families can provide a vital, loving safety net. These family settings are preferable to group homes and institutions, as children need at least one trusted, committed parental figure for healthy and successful development.[1]
Because of the trauma they have experienced, children placed in out-of-home care (also known as foster care) are more likely to have high levels of behavioral and emotional problems. They are also more likely to have a limiting physical, learning, or mental health condition, and to be suspended or expelled from school. Children who spend long periods of time in multiple foster care homes are more likely to experience unemployment, homelessness, and incarceration in adulthood.[2]
Kinship care is the optimal situation for children placed in out-of-home care as it enables children to maintain familial bonds and cultural connections. Research shows that children raised in kinship care have fewer educational disruptions and behavioral problems.[3] Kentucky recently made it easier, through a change in law, for children to be placed with close family friends when out-of-home care is needed.[4]
Since 2011, both Kentucky and the nation have seen annual increases in the number of children in foster care, but the change has been much more pronounced in Kentucky. From 2011 to July 2017, Kentucky experienced a 24.5 percent increase in the number of children in out-of-home care.[v]
[1] Center on the Developing Child (2010). The Foundations of Lifelong Health Are Built in Early Childhood. Available at https://developingchild.harvard.edu/resources/the-foundations-oflifelong-health-are-built-in-early-childhood/.
Accessed October 2017.
[2] Child Trends Databank (2015). Foster Care. Available at https://www.childtrends.org/indicators/foster-care/. Accessed October 2017.
[3] Annie E. Casey Foundation (2012). Stepping Up for Kids: What Government and Communities Should Do to Support Kinship Families. Available at http://www.aecf.org/resources/stepping-upfor-kids/. Accessed October 2017.
[4] Kentucky Legislative Research Commission. Kentucky Revised Statute 620.140. Available at http://www.lrc.ky.gov/Statutes/statute.aspx?id=45707. Accessed October 2017.
[v] Kentucky Legislative Research Commission, Program Review and Investigations Committee (Nov. 9, 2017 Draft). Kentucky’s Foster Care System. Available by request.
37.2
2012-14
51.1
2017-19
Children in foster care (rate per 1,000 children ages 0-17)

Source: Kentucky Cabinet for Health and Family Services, Department for Community Based Services
Children in foster care (rate per 1,000 children ages 0-17), 2019

Sources: Kentucky Cabinet for Health and Family Services, Department for Community Based Services. Child population data for rate calculation is from the U.S. Census Bureau, National Center for Health Statistics.
Note: Data not available for other racial groups.
CHILDREN EXITING FOSTER CARE TO REUNIFICATION
NUMBER OF CHILDREN:6,998 (2017-19)
41%
2012-14
37%
2017-19
Children exiting foster care to reunification (percent)

Source: Kentucky Cabinet for Health and Family Services, Department for Community Based Services
Children exiting foster care to reunification with parent or primary caretaker, 2019

Source: Kentucky Cabinet for Health and Family Services, Department for Community Based Services.
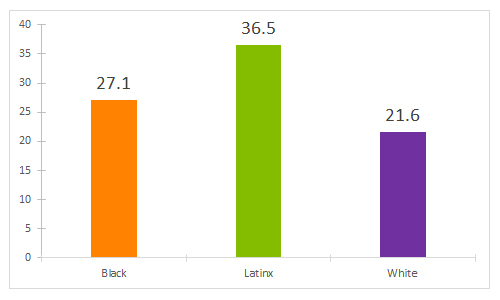
YOUTH INCARCERATED IN THE JUVENILE JUSTICE SYSTEM
(rate per 1,000 youth ages 10-17)
NUMBER OF YOUTH: 12,358 (2017-19)
Youth Incarcerated in the Juvenile Justice System
Kentucky’s future prosperity depends on all youth making a successful transition to adulthood and becoming productive citizens of our Commonwealth. An efficient and effective youth justice system holds kids accountable, helps them grow up to become contributing members of their community, and increases public safety.
When adolescents engage in troubling behavior, appropriate and consistently applied discipline is needed to ensure that they have opportunities to learn from mistakes. Research shows that incarcerating youth – a practice also known as secure detention – is rarely the appropriate response to youth misbehavior. Not only is incarceration the most expensive approach, but it is also the least effective, as youth who are detained face greater risk of poor education, work, and health outcomes, as well as future incarceration.[i]
Incarceration itself is the most significant factor in increasing the odds a youth will continue to misbehave after being released. Several studies show that incarcerated youth are more likely to misbehave again than youth placed under supervision in a community-based setting, or not incarcerated at all.[ii]
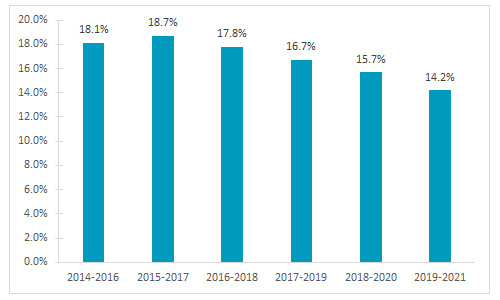
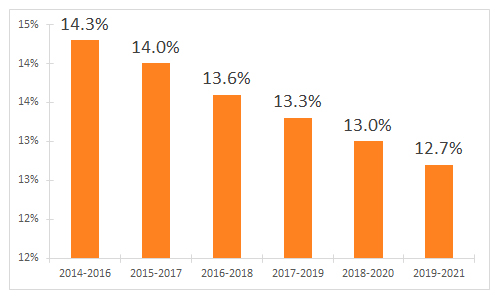
Kentucky’s rate of incarcerating youth in the juvenile justice system fell 57 percent from 2008-2010 to 2014-2016 and is expected to continue falling as juvenile justice reforms are implemented statewide.
[i] Nelson, D. (2008). “A Road Map for Juvenile Justice Reform.” 2008 National KIDS COUNT Data Book. Annie
- Casey Foundation.
[ii] Holman, B., and Ziedenberg, J. (2006). The Dangers of Detention: The Impact of Incarcerating Youth in Detention and Other Secure Facilities. Justice Policy Institute. Available at http://www.justicepolicy.org/images/upload/06-11_REP_DangersOfDetention_JJ.pdf. Accessed November 2017.
37.5
2012-14
27.1
2017-19
Youth incarcerated in the juvenile justice system (rate per 1,000 children ages 10-17)

Source: Kentucky Department of Juvenile Justice and Louisville Metro Youth Detention Services
Youth incarcerated in the juvenile justice system (rate per 1,000 children ages 10-17), 2018

Sources: Kentucky Department of Juvenile Justice and Louisville Metro Youth Detention Services, processed by Kentucky Youth Advocates. Child population data for rate calculation is from the U.S. Census Bureau, National Center for Health Statistics.
Note: Data not available for other racial groups.
Data Dashboard updated November 2020