 Patterns emerge all the time around us, whether watching the beautiful display of a spider spin its web in a meticulous, lattice-like fashion or the furiously fast movement of a hummingbird’s wings as nectar is consumed in a moment of time. Bottom line, if we are not paying attention then we just may miss a chance to bring to light what is happening.
One pattern that caught my eye recently was a U.S. Census Bureau blog post on sustained high-poverty counties in the U.S. – defined as counties whose poverty rates remained at 20% or higher across four nonoverlapping 5-year periods – which inspired my interest in writing this one.
For this post, I analyzed three consecutive non-overlapping time periods (2010-2014, 2015-2019 and 2020-2024) of child poverty rate data for all 120 Kentucky counties to see if any trends developed over a 15-year window.
Of the 120 counties (see map below), 51% (n=61) experienced child poverty rates of 20.0% or greater over the course of all three time periods. Meanwhile, 40% of counties (n=48) did not meet this sustained threshold and 9% of counties (n=11) were excluded from the analysis due to having at least one time period where the estimate was deemed unreliable via statistical testing.
Another interesting distinction was that among the 61 counties that met the sustained criteria of a child poverty rate of 20.0% or higher, a third of those counties (n=20) had even higher sustained rates of 30.0% or higher.
However, a positive pattern also showed up: less and less counties had persistent rates of child poverty, meaning KY counties are seeing fewer kids living in poverty each year. As the chart below shows, as time went on, the number of counties that fell into the 0%-19.9% category (lowest) for each respective time period grew. Meanwhile, the number of counties in the 40.0% and above categories (highest) shrank, meaning fewer counties saw persistent rates of child poverty across the time period analyzed.
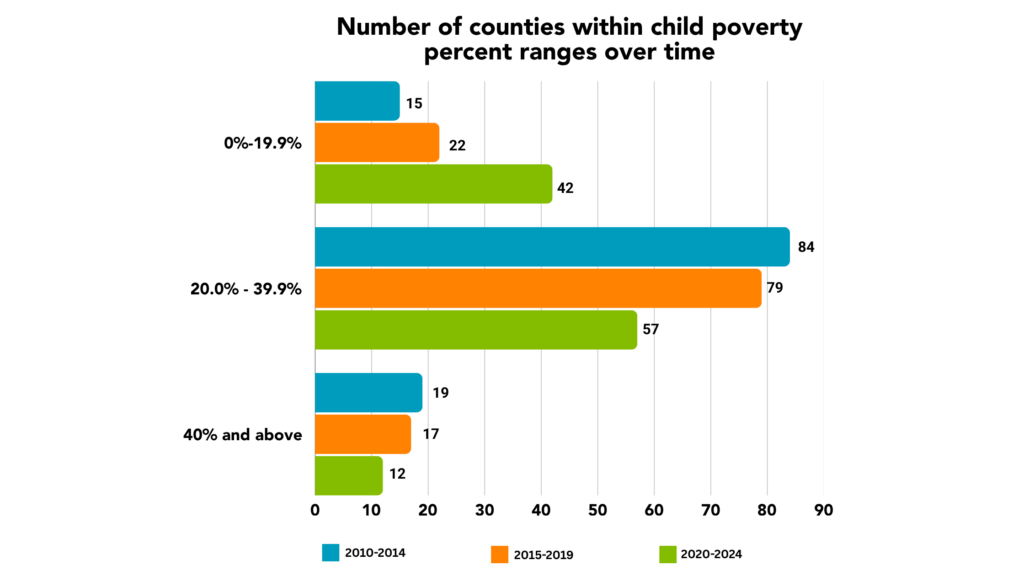
Source: U.S. Census Bureau, American Community Survey Estimates, 2010-2014, 2015-2019 and 2020-2024. Please note that some counties were excluded due to the estimate being deemed unreliable.
All in all, these trends could be showing us that counties are seeing fewer kids growing up in persistent poverty, or the trends we see here could reverse. It is up to policymakers in DC and Frankfort to make policies that ensure this is a trend that continues, and it’s up to all of us to continue to fight to ensure all Kentucky children have the resources they need to grow into the leaders of tomorrow.


Leave A Comment