 November mornings in Kentucky are as divisive as a UK/UL basketball game. On one day, as dawn breaks and the sun glistens effortlessly across the dew soaked bluegrass, you are reminded of the subtle beauty of life’s simple pleasures. Meanwhile, on the very next day, as the crisp air whirls dead leaves amidst a dense dreary haze, you instantly regret leaving the comforts of a warm bed. Regardless of what type of morning it is on November 4th, just remember that from 6:00 a.m. to 6:00 p.m. you have the ability to stand up for Kentucky’s kids and vote.
The act of voting is the definitive pulse of the body politic and embodies the core essence of our shared construction of democracy. It not only gives people the chance to choose who will represent them in given elected offices, but also serves as a symbol of civic engagement that generations of yesteryear have valiantly fought for and continues to be a privilege that others still battle for today.
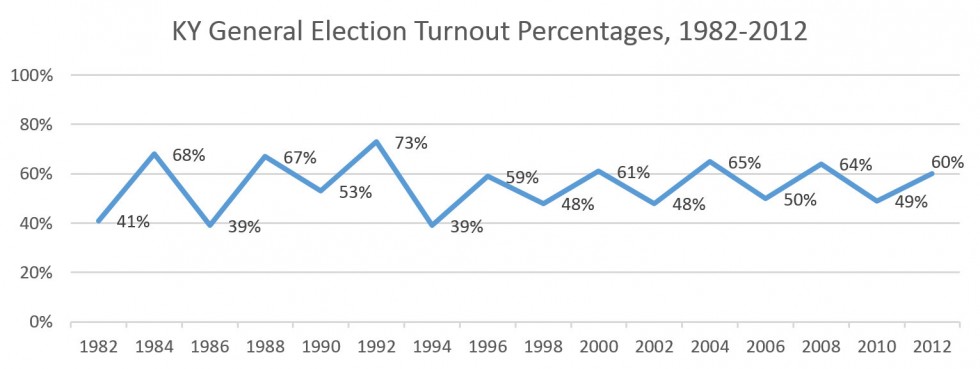
I recall being a sophomore in high school as the first time I truly got swept up into the election cycle hype and conceptualized the importance of voting, even though I still had a few years until I could legally cast a ballot. It was the year 2000; the world had just survived the catastrophic aftermath of Y2K, and the term “hanging chads” was introduced into our collective political lexicon. As I now reflect back on the settled dust of Bush vs. Gore–aside from faint recollections of cable news pundits’ hyper sensational commentary–the one thing that struck me was the lack of voter turnout. In fact, 73% has been the highest recorded proportion of registered KY voters that have actually voted in the general election since 1982. If another sophomoric memory serves correct, a 73% is still a C–or maybe a D? Bottom line, Kentucky’s kids deserve an A+. They deserve no less than a turnout of 100%.

Source: Kentucky State Board of Elections, Turnout Statistics. Available at http://elect.ky.gov/statistics/Pages/turnoutstatistics.aspx.
Notes: Percentages were rounded to nearest whole percent. Data reflect the proportion derived by dividing the number of voters into the number of registered voters. Only even numbered years are displayed in the graph.
It is probably safe to assume that unless you have no phone, no television, no radio or no internet access then you have likely grown tired of the continuous bombardment of campaign ads and solicitations that have invaded our collective sphere of communication. However, don’t let the disheartening echo of selective half-truths deter you from exercising your right to vote.
Have you educated yourself on what the candidates stand for that are up for election in your district? Do you know your rights? Find your polling place here or by calling 1-800-246-1399 and remember to vote for kids on November 4th!


Leave A Comment